

Reports: give it data and a question, get a report that leads with the answer
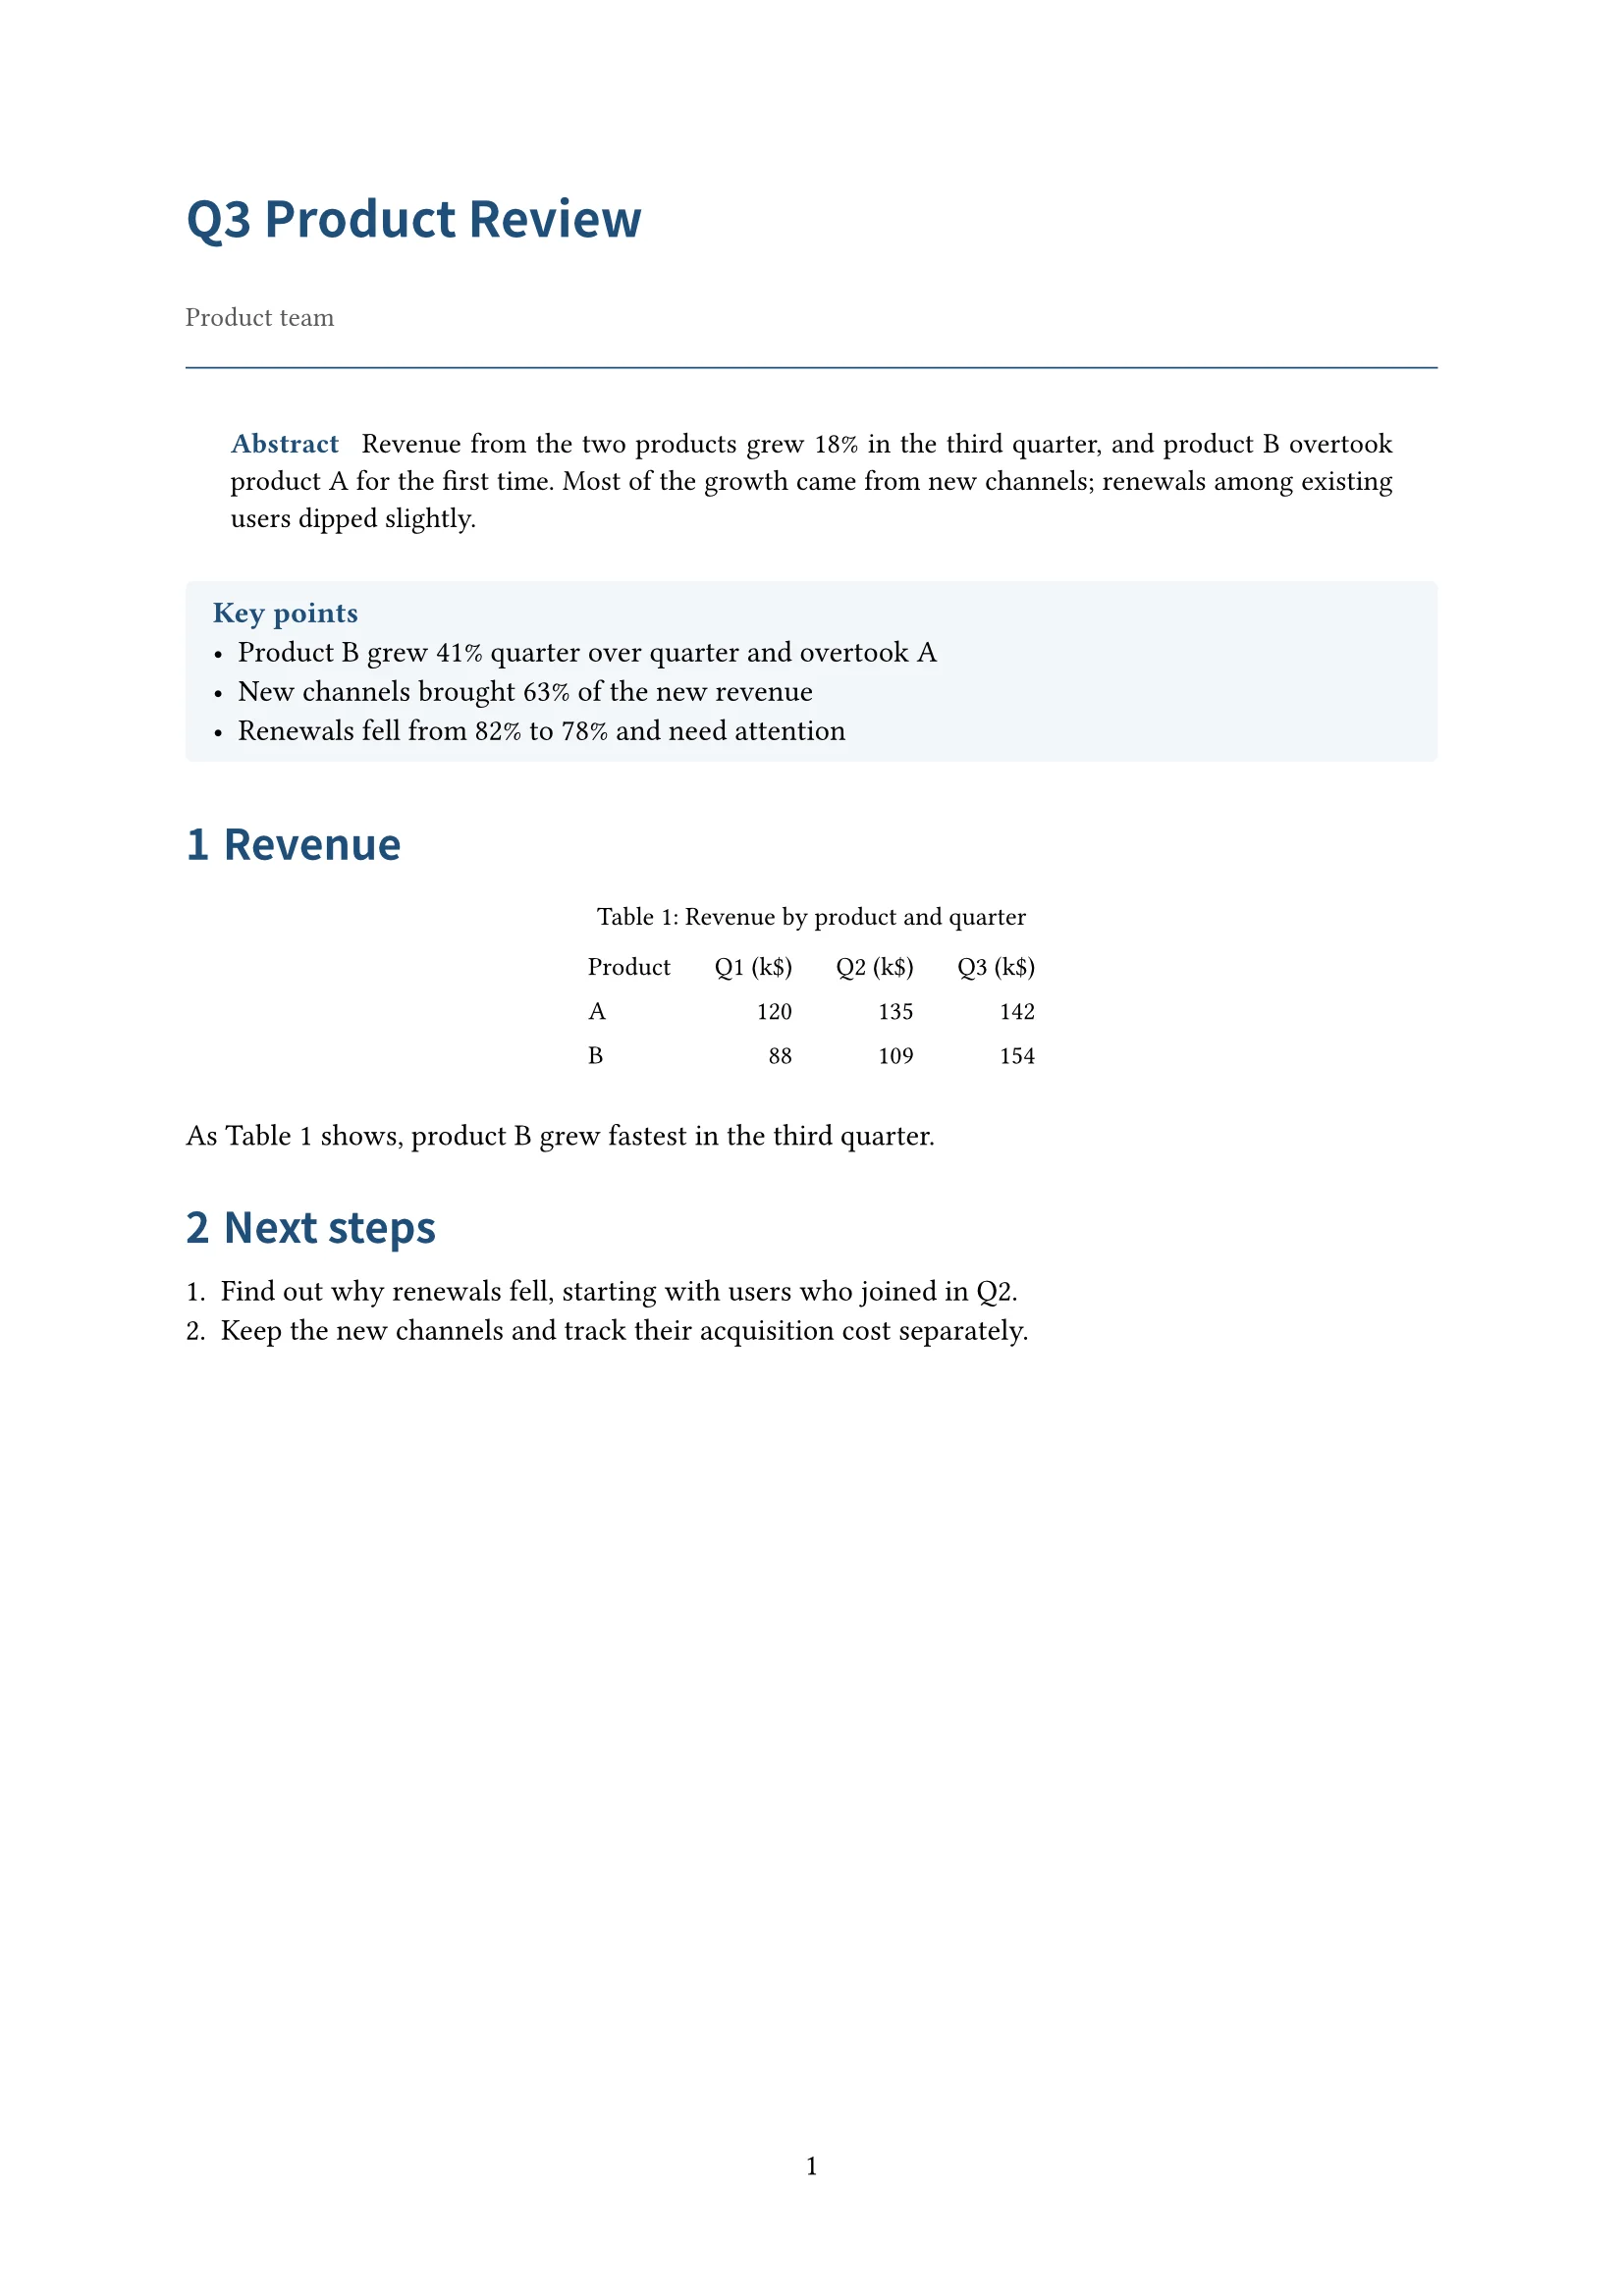
Upload sales data or research notes and say what the report has to answer. docraft typesets a report that opens with a summary and key points, followed by charts drawn from your data, analysis and recommendations.
Start free, no credit card needed.
What it does
Summary and key points first
Readers see the conclusions first and the evidence after; heading levels and numbering are handled by the template.
Charts from the data
Lines for trends, bars for comparisons, sorted bar charts for shares, scatter plots for relationships, with the key points called out.
Clear tables
Data tables are aligned, with units and captions, and can be referenced by number.
Only what the data supports
Conclusions come from your data and material; guesses and missing context go on the checklist, not into the text.
How it works
- 1
Upload the data or material and say what the report should answer and who will read it.
- 2
docraft typesets the report and lists the numbers and conclusions to confirm.
- 3
Point at a chart or paragraph to change it, then export the PDF or share it for comments.
Try saying
“Here are this year’s quarterly sales (Excel). Write a two-page review: which product line grew fastest, and what to watch next quarter.”
Frequently asked questions
What data can I use?
CSV and Excel spreadsheets, plus text and PDF material. Clear headers with units make the charts more accurate.
Can it make pie charts?
It uses a sorted bar chart instead, since lengths are easier to compare than angles, and says why.
Can colleagues work on it too?
The Team plan lets several people edit; you can also share a read-only link and allow reviewers to annotate.
Do I need design or typesetting software?
No. Describe what you need; docraft typesets with Typst and you can point at the page to change anything.
Related templates
Lab report
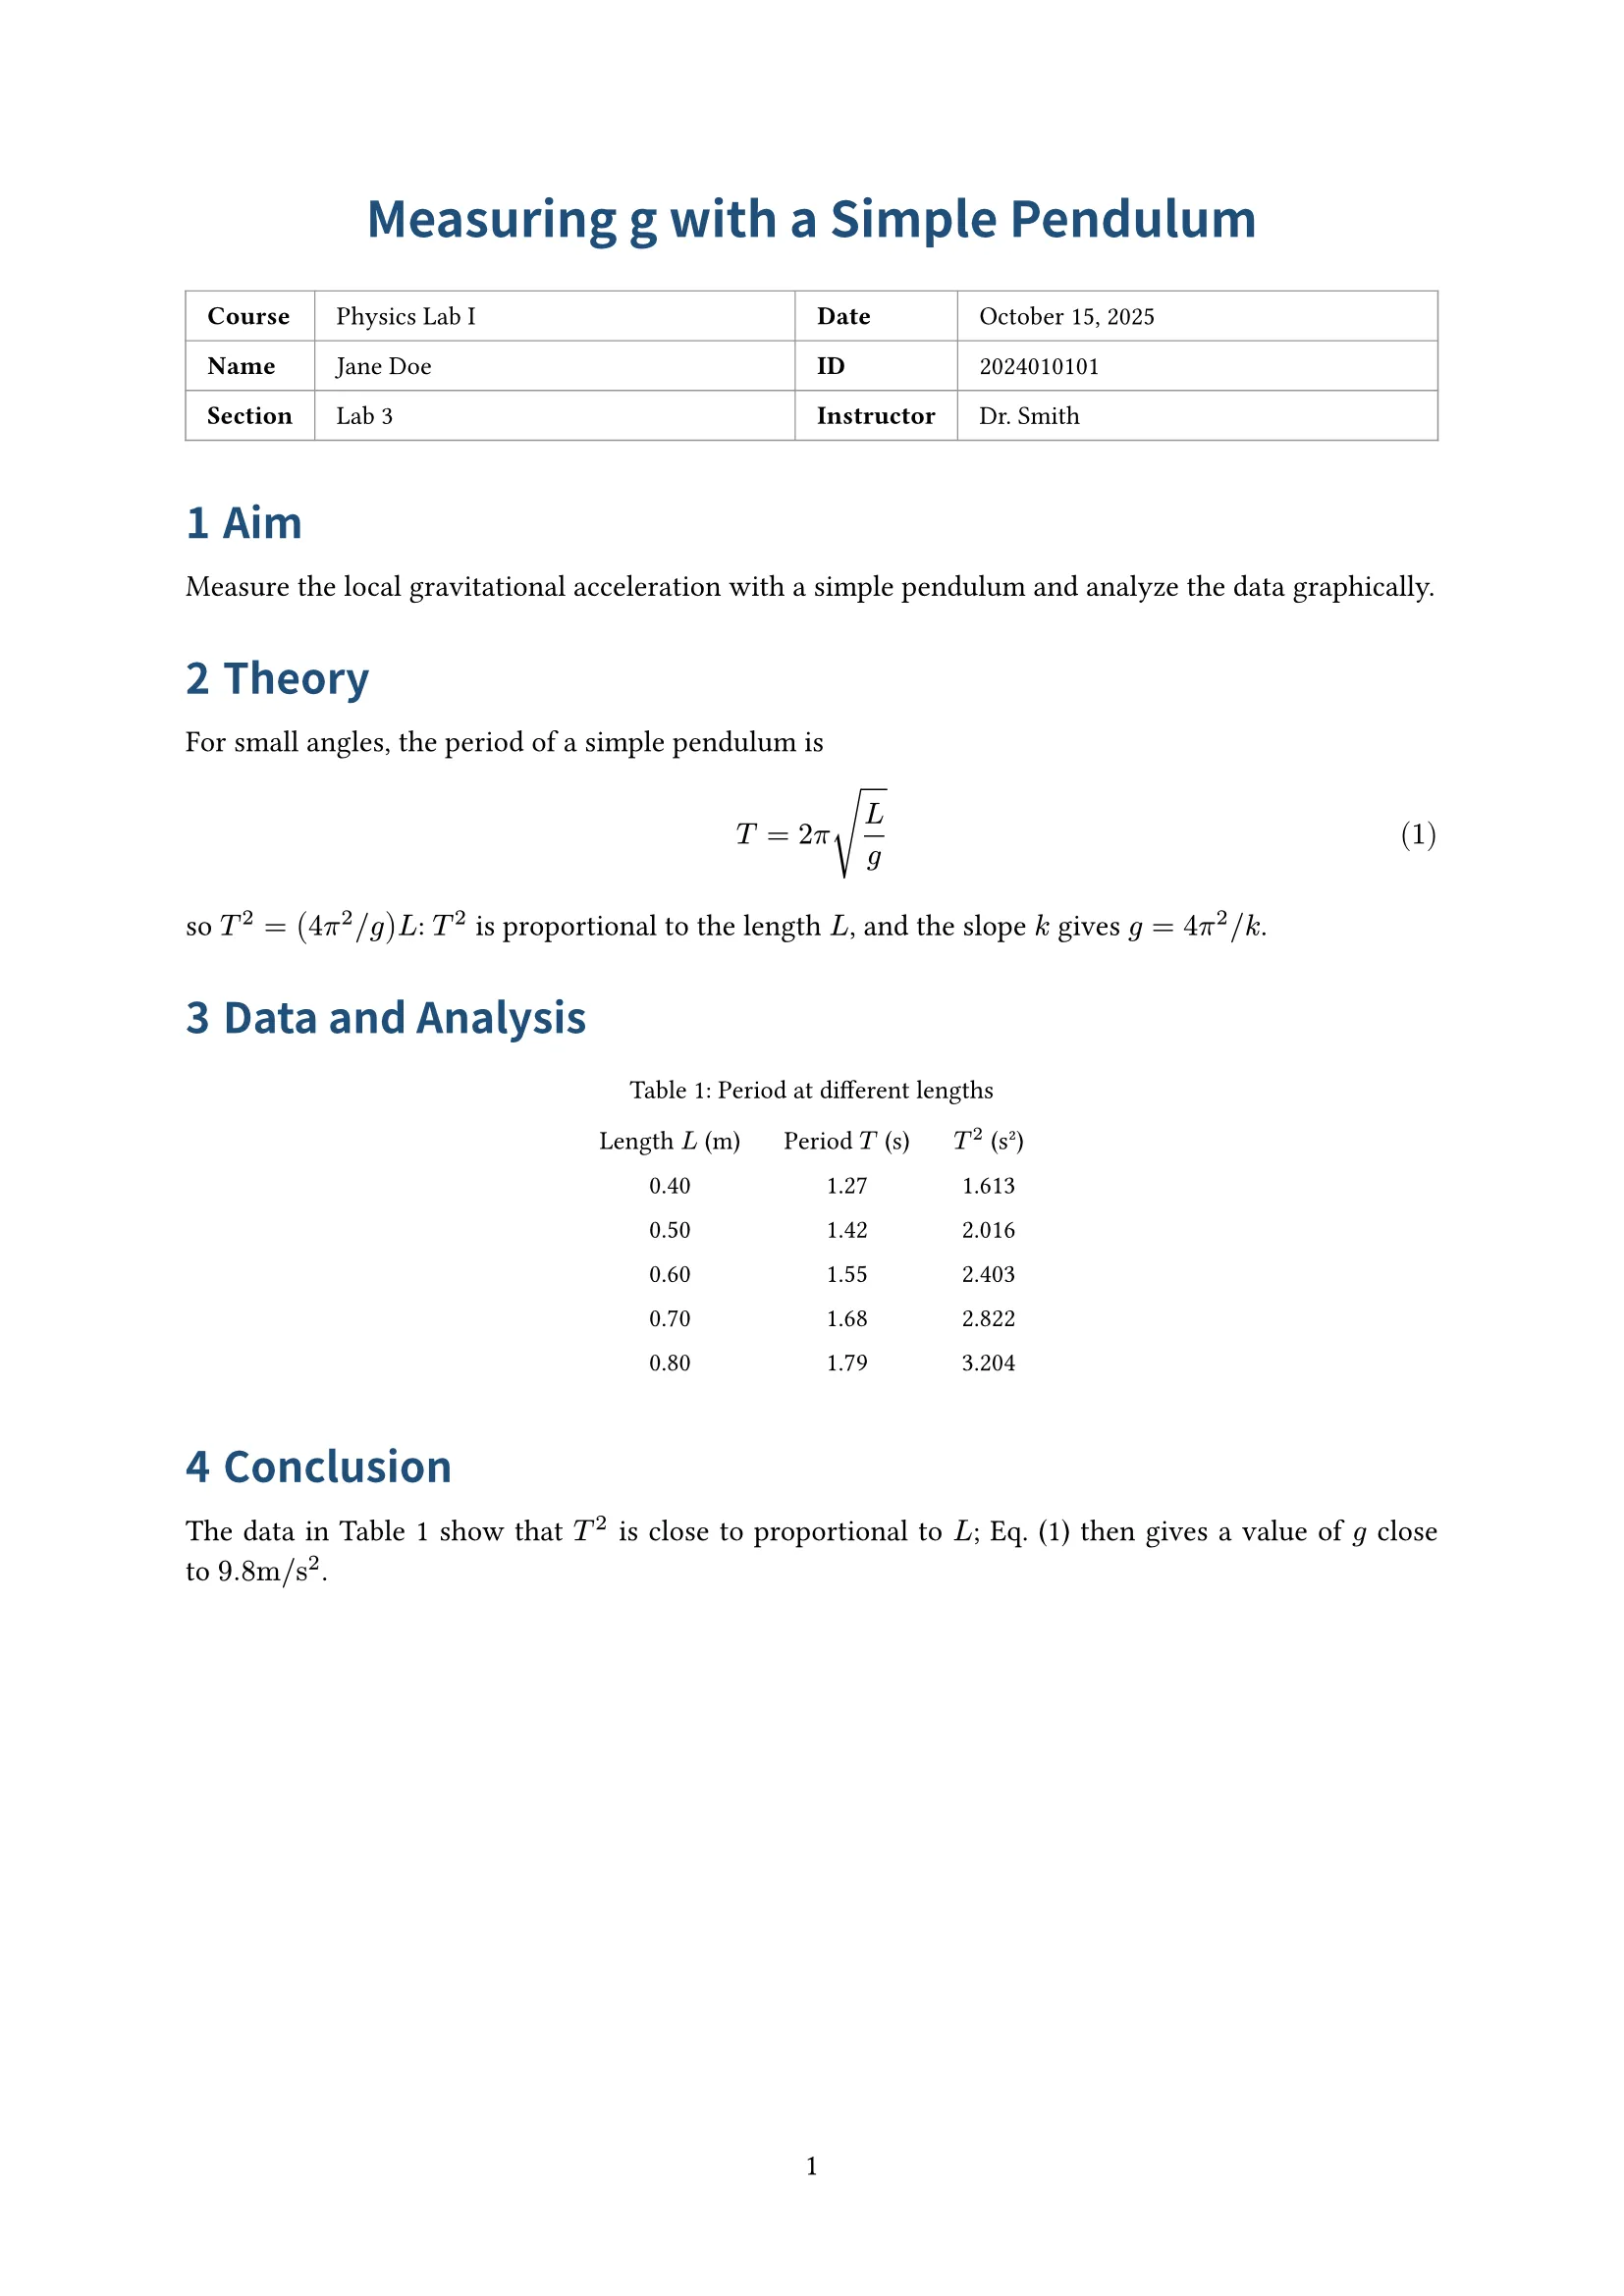
Info table (course, name, ID…), aim, theory, procedure, data and analysis, conclusion; for lab courses
Article
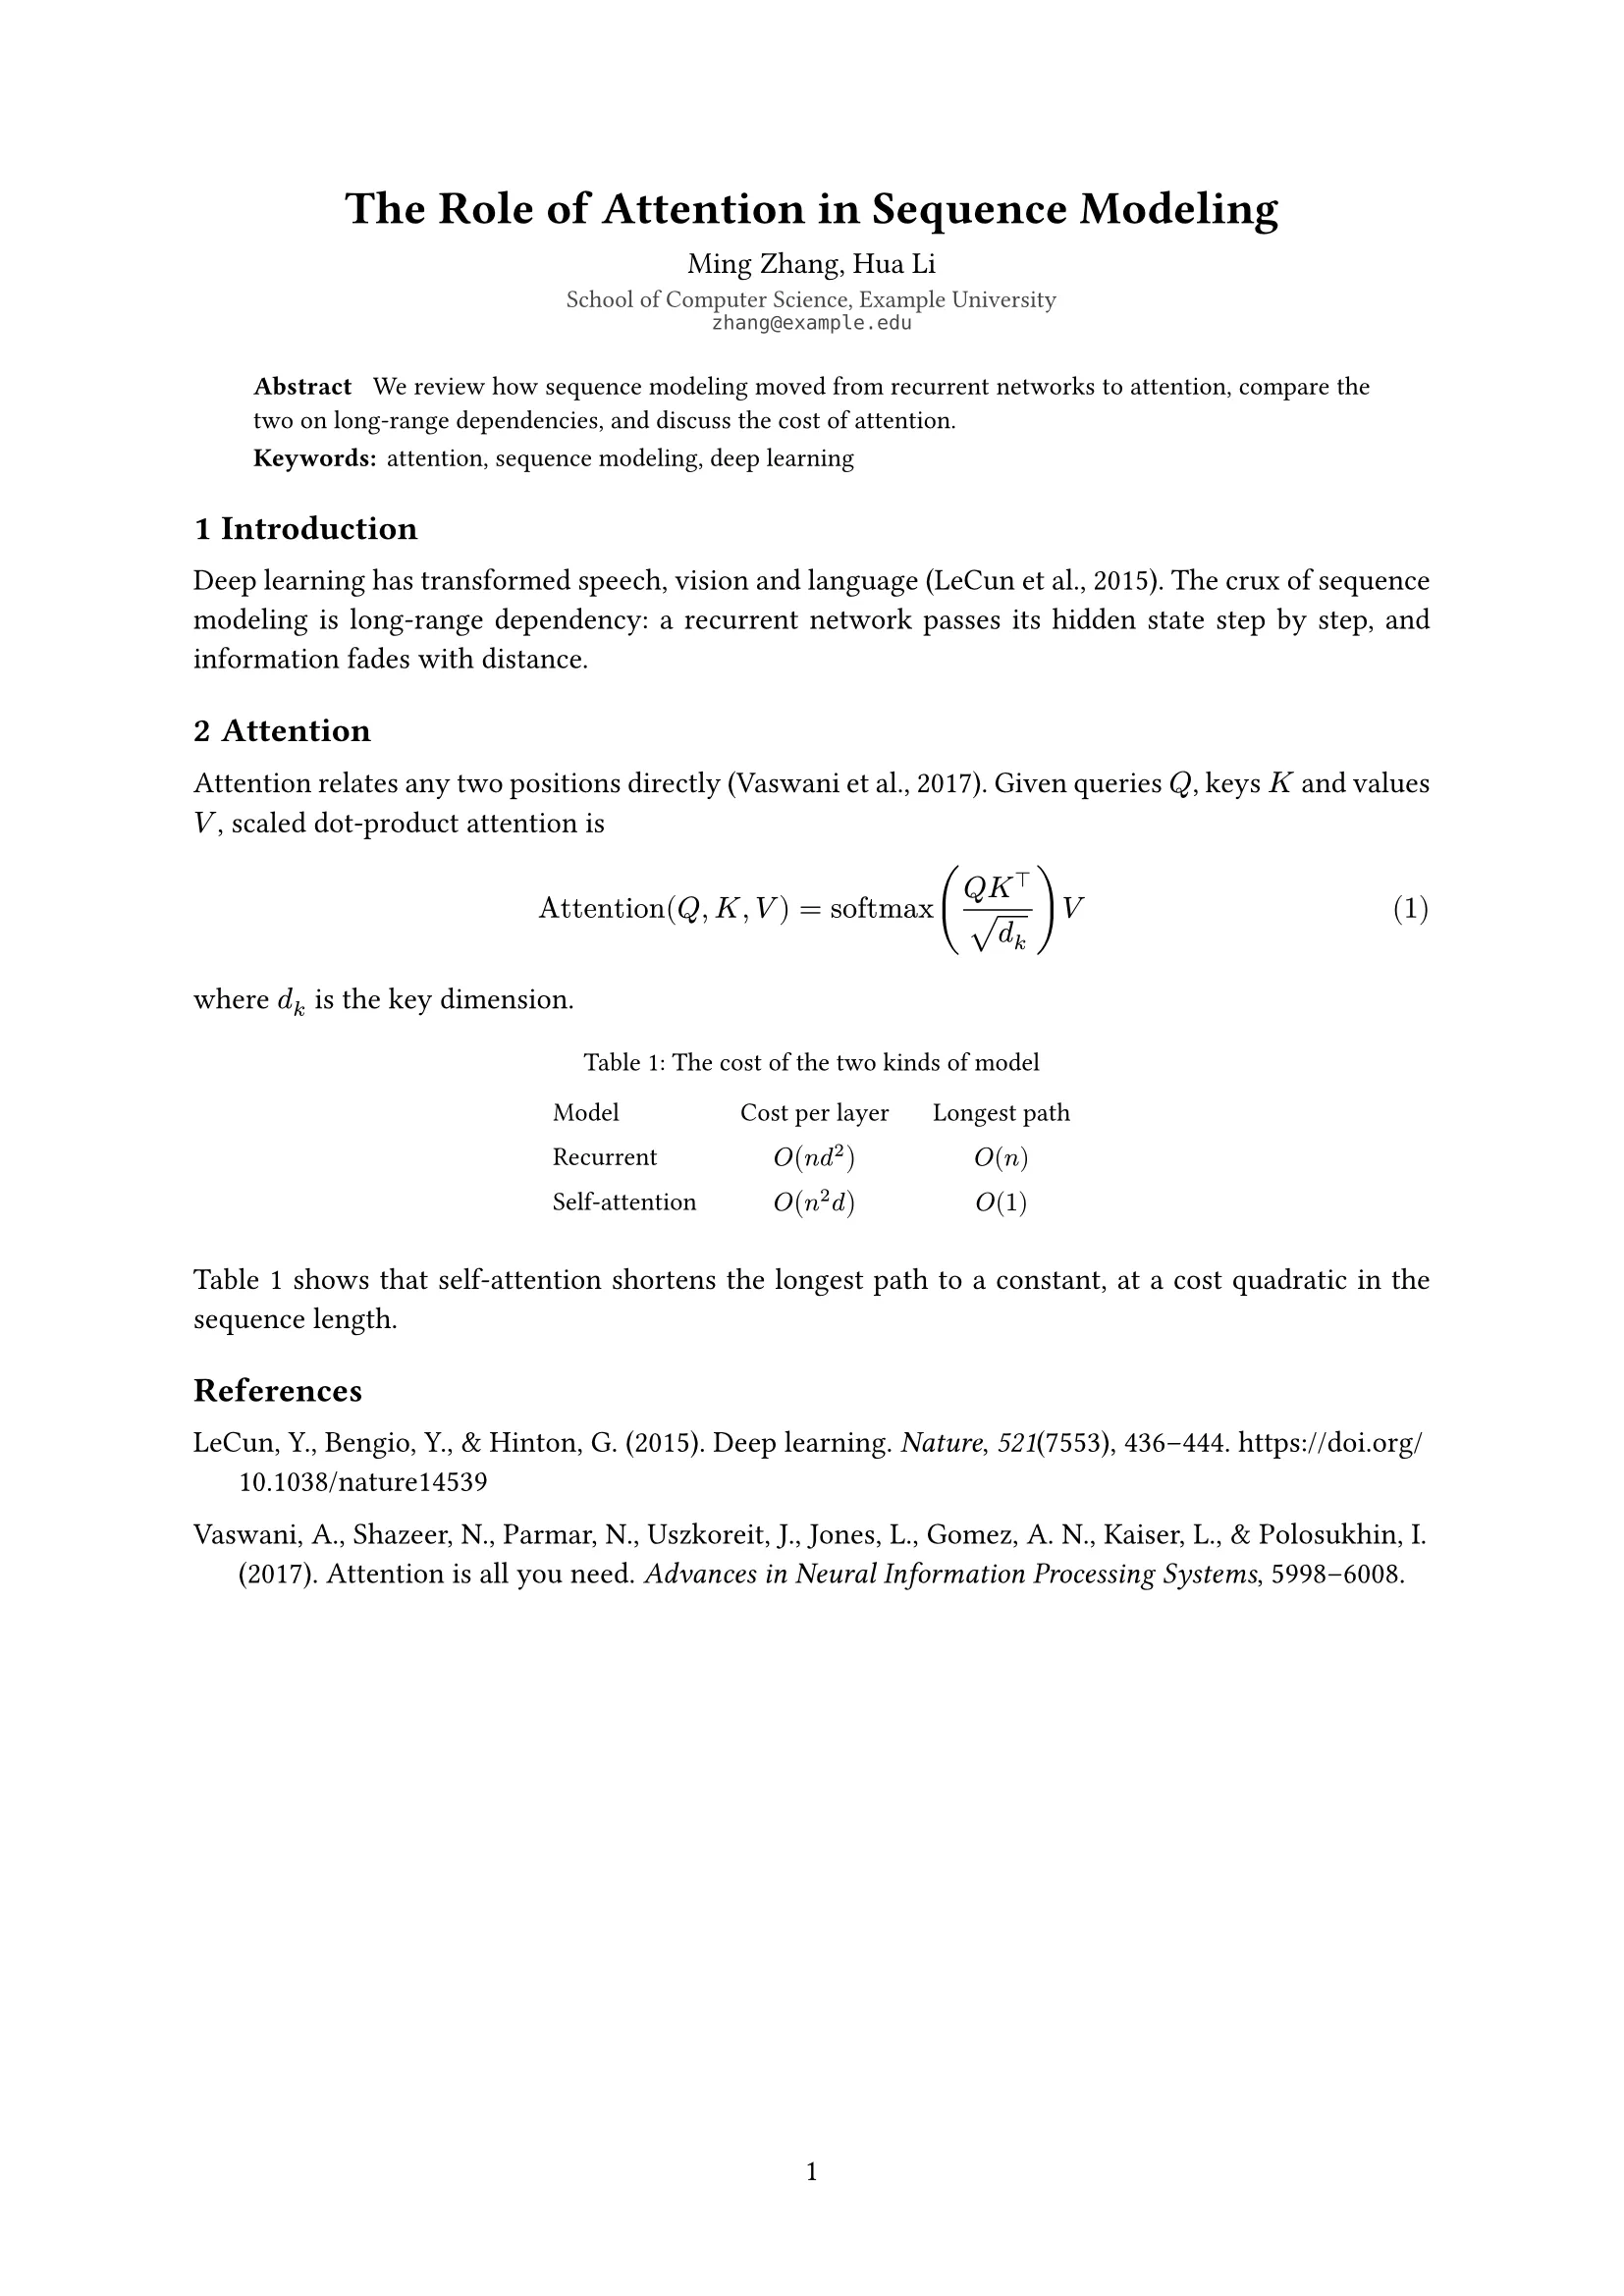
Single column with title, authors, affiliations, abstract and keywords; for course papers and preprints
Handout
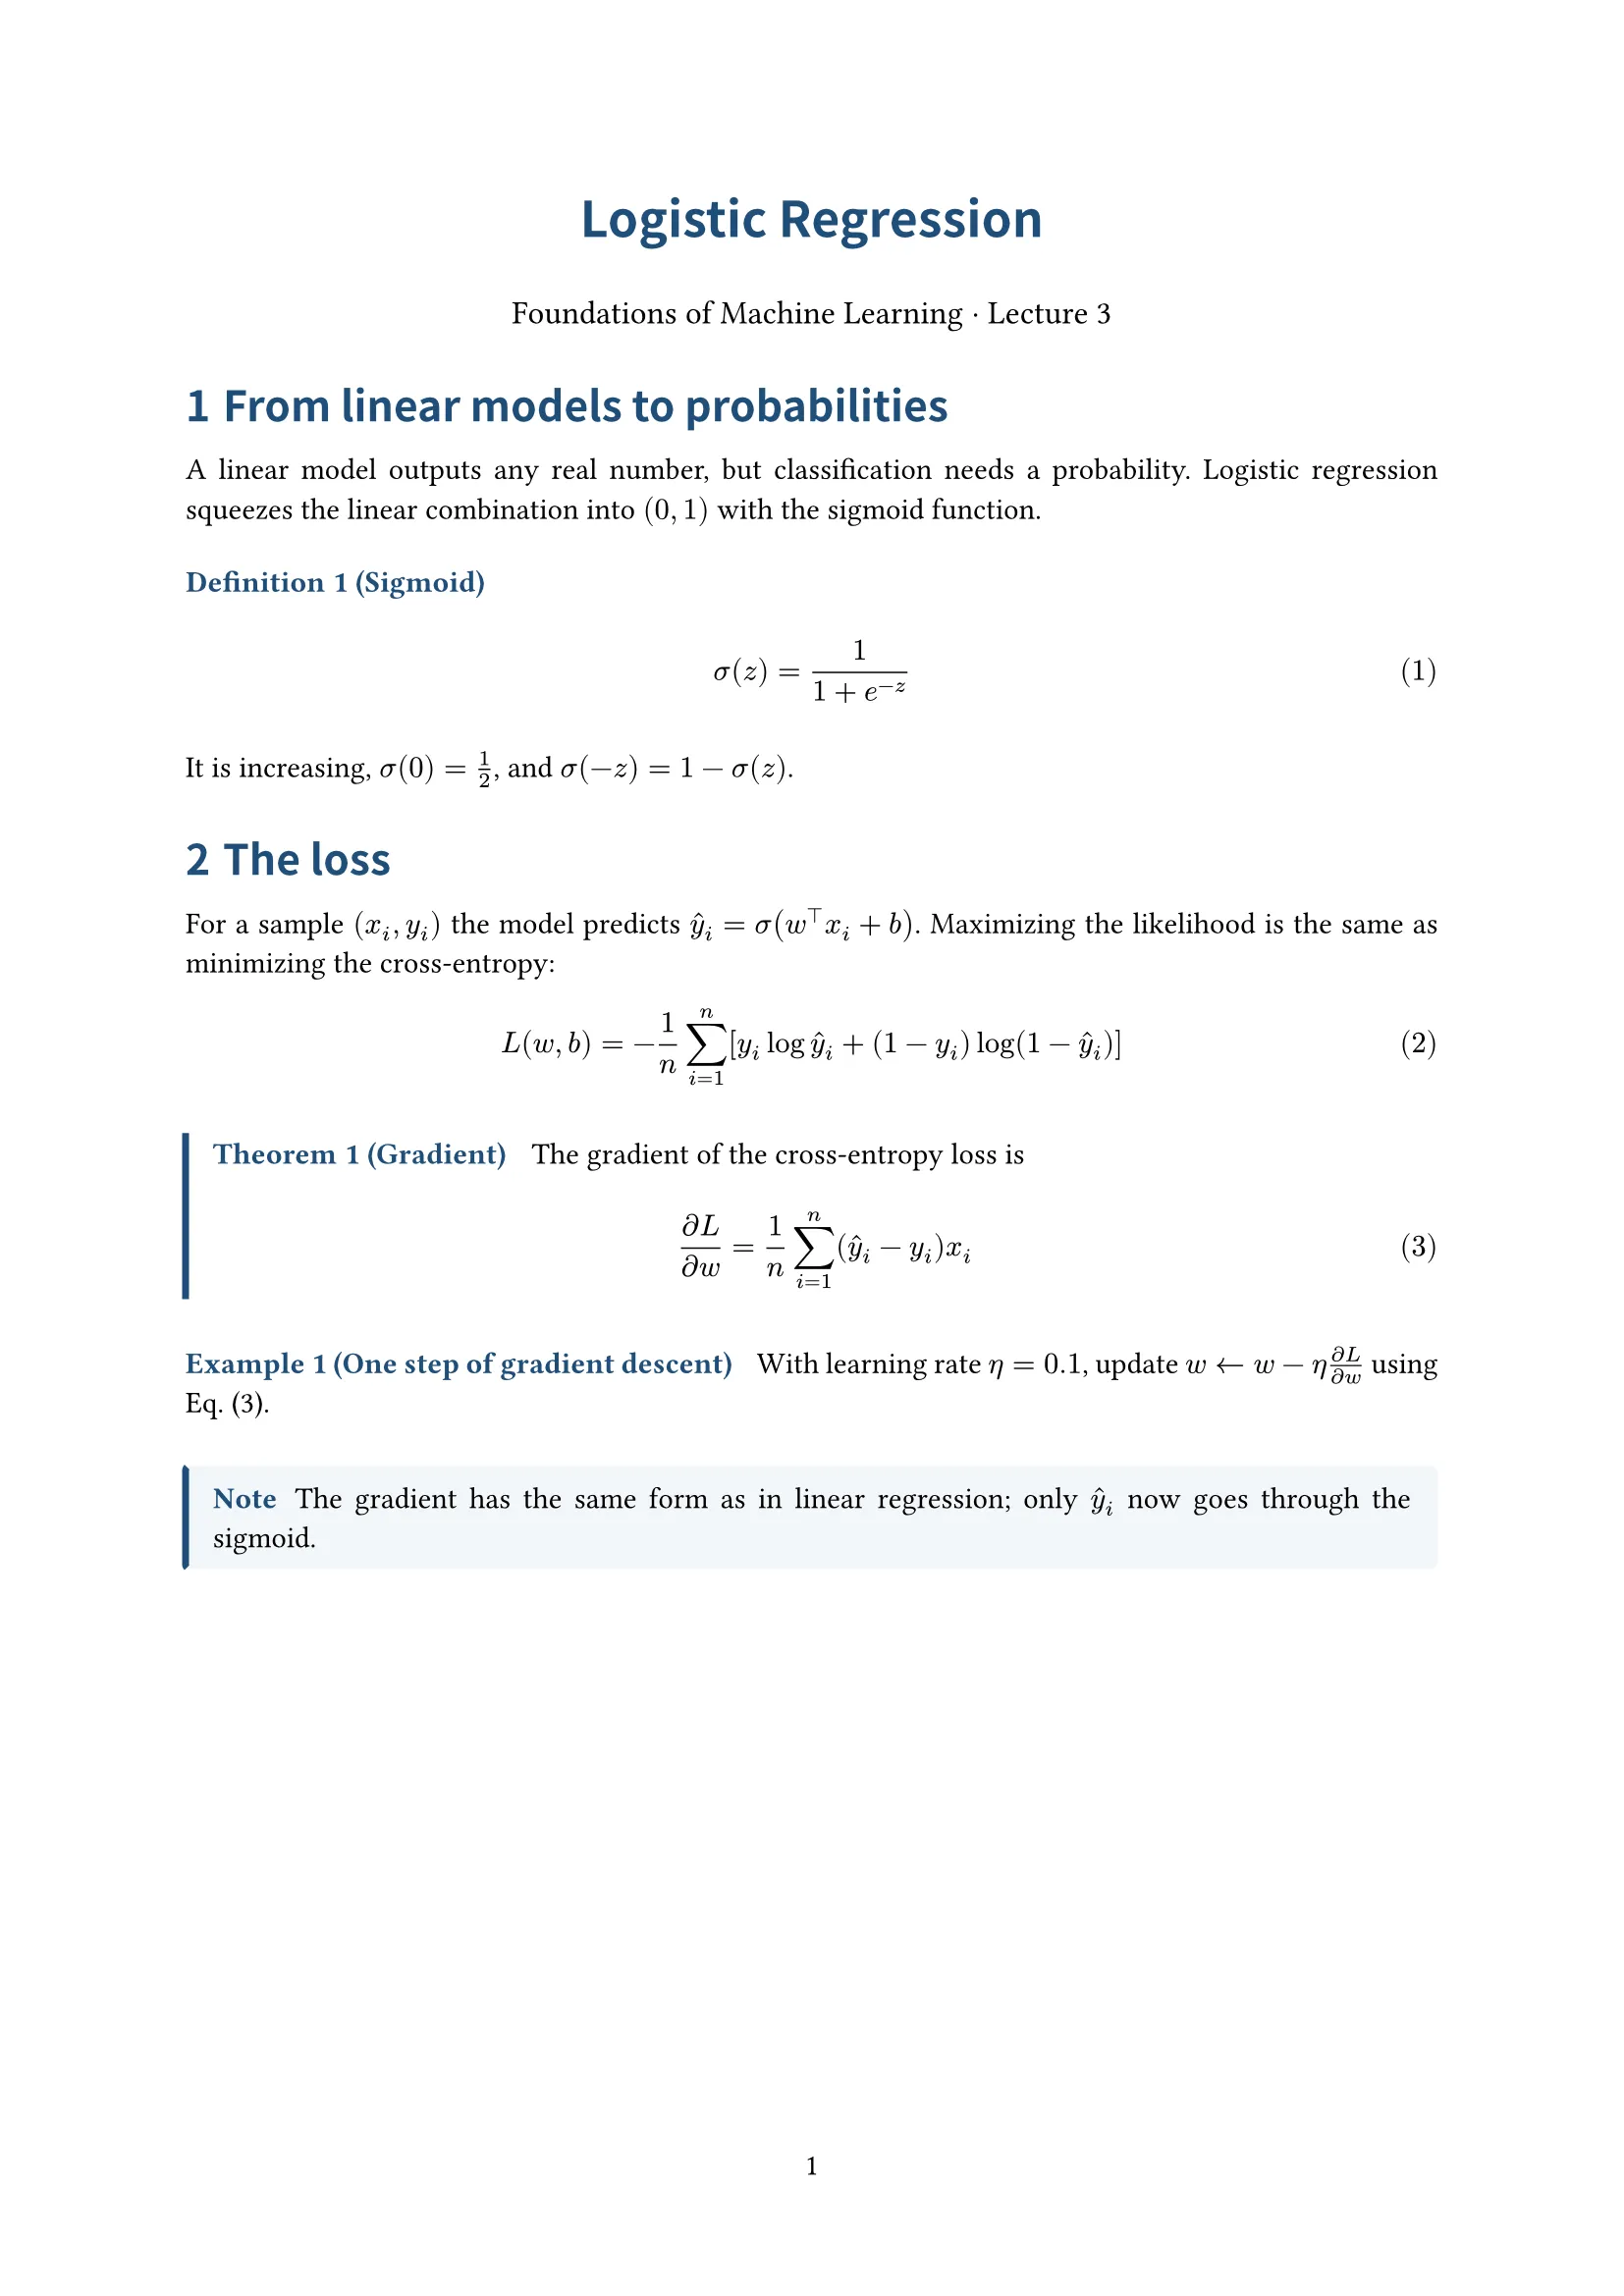
Centered title, numbered definitions, theorems and examples; for lecture notes


