

Lab reports: upload your measurements, get a typeset report
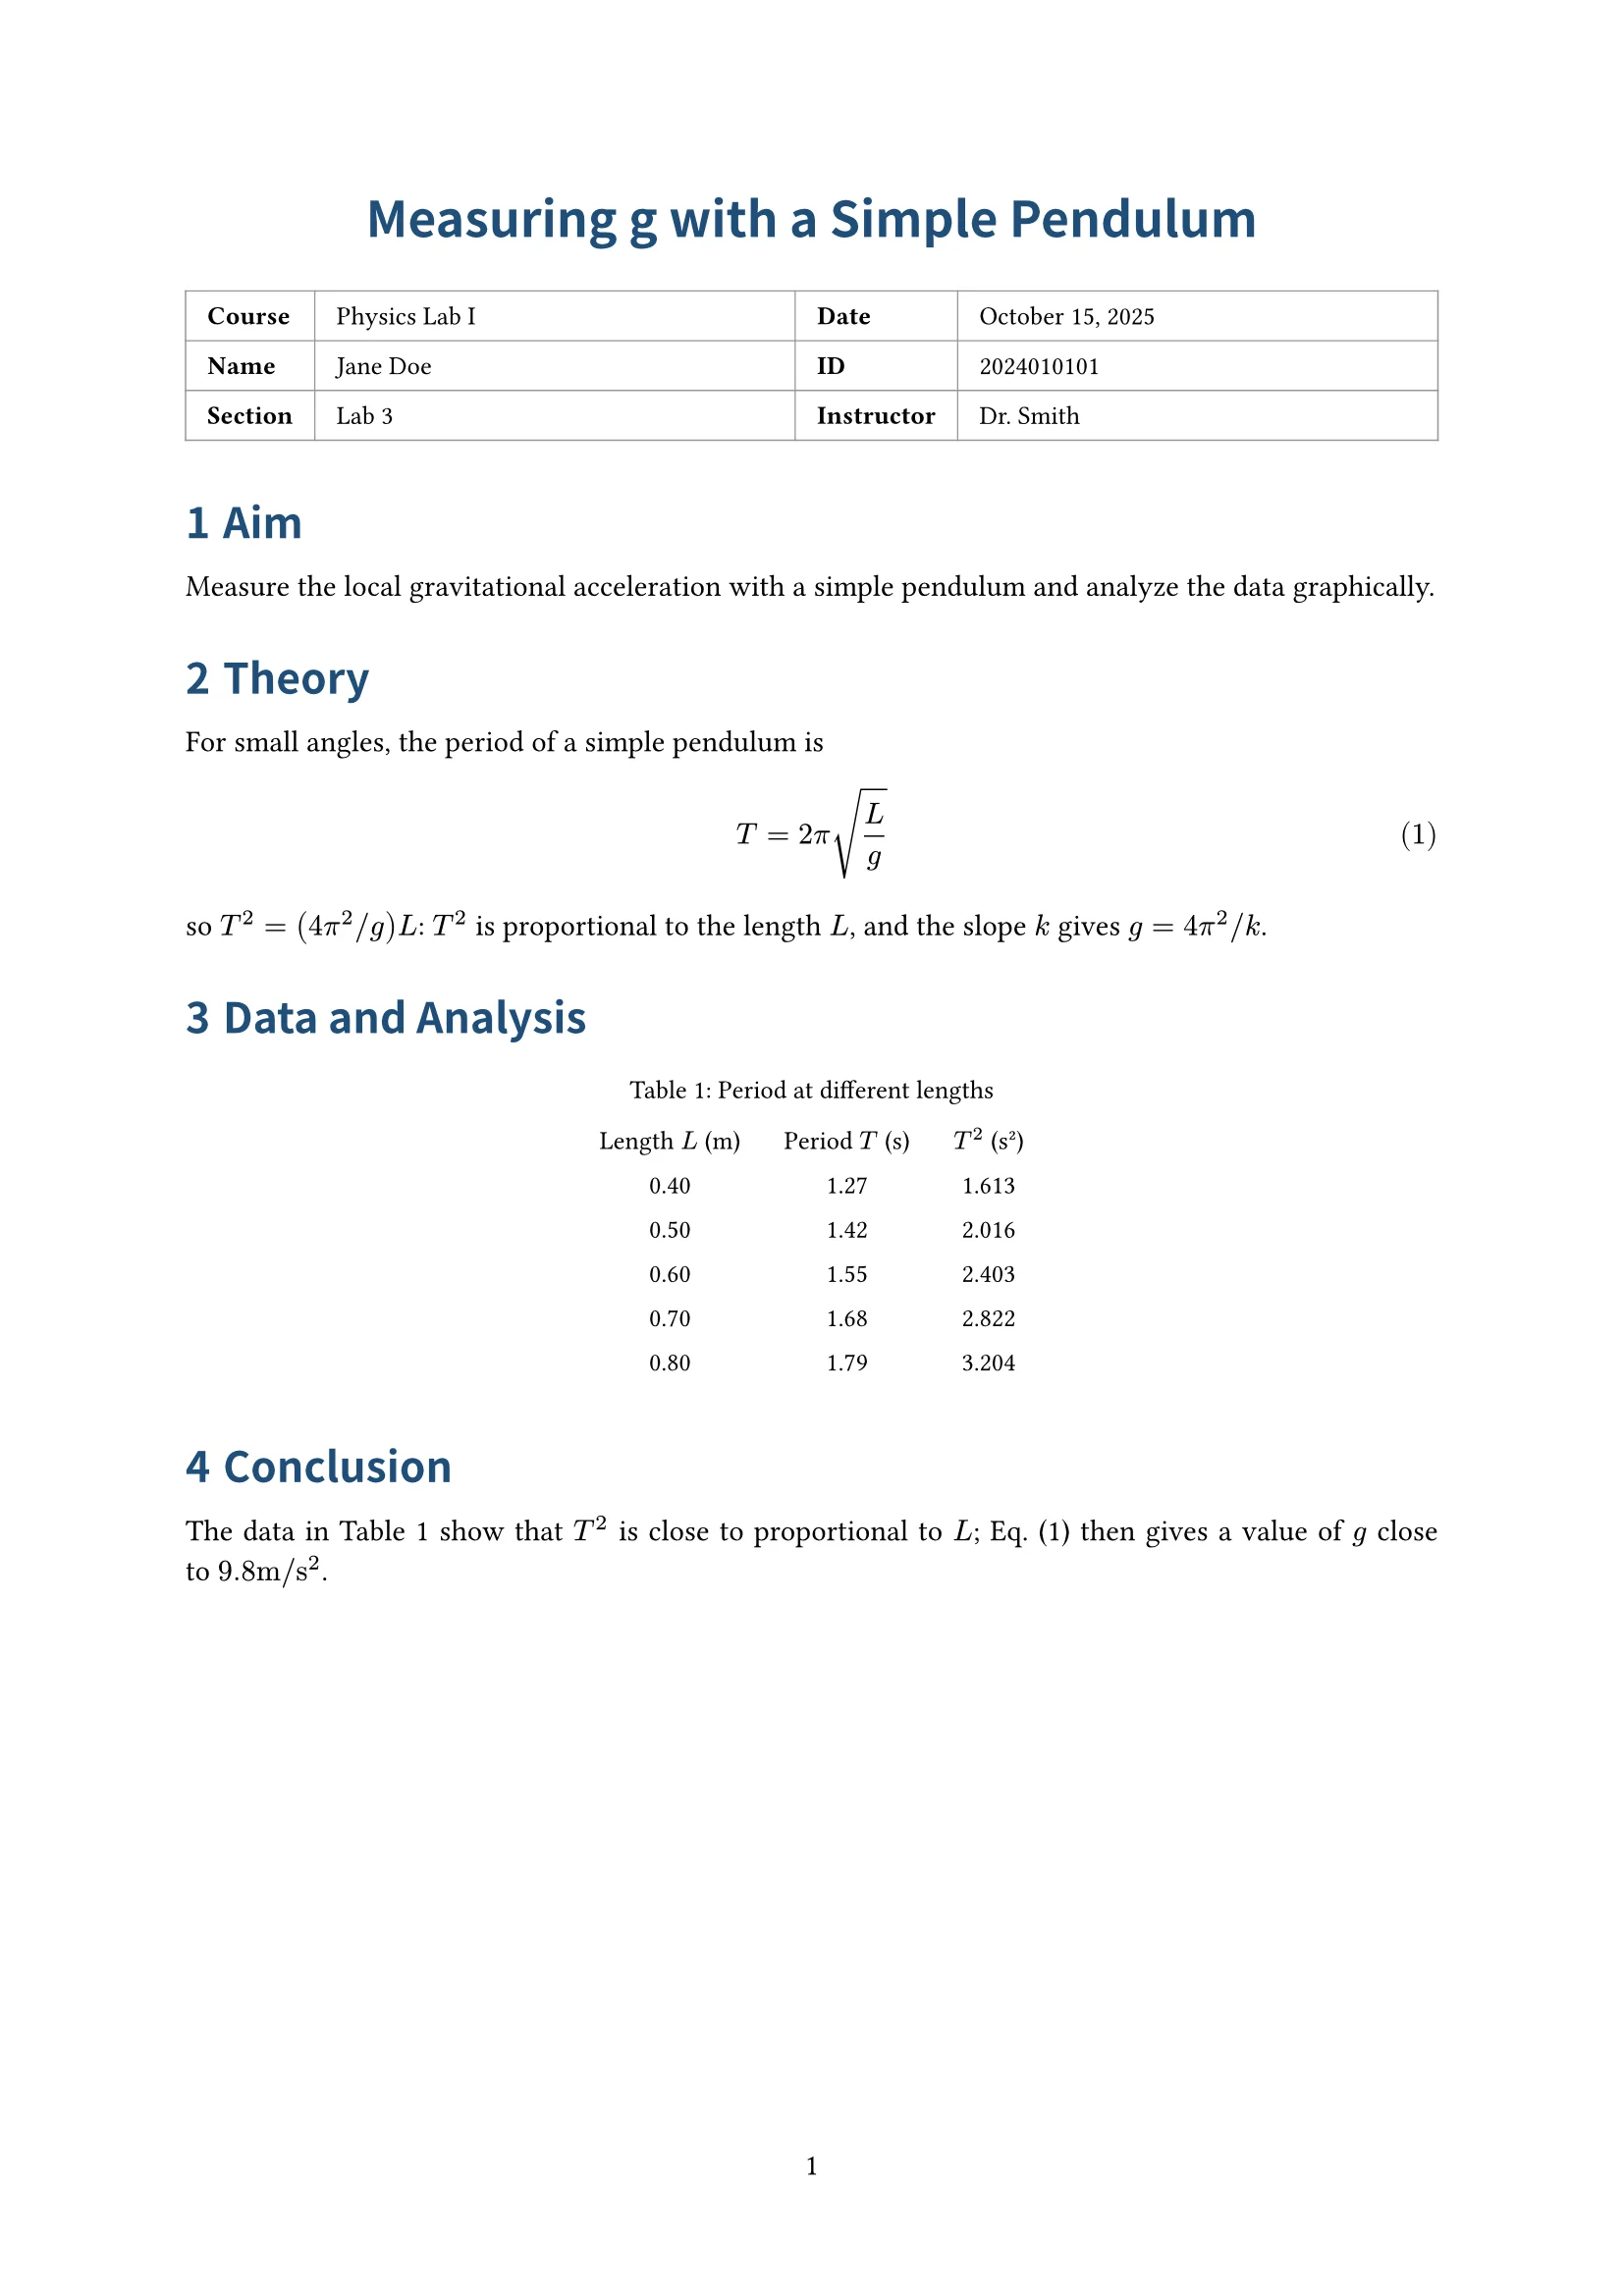
Upload the data and give the experiment, course and your details. docraft typesets a complete report with an info table, aim, theory, procedure, data and analysis and a conclusion, with the data plotted and fitted.
Start free, no credit card needed.
What it does
The usual structure
An info table with course, name, ID and date, then aim, theory, procedure, data and analysis and conclusion, in the order lab courses expect.
Data straight to plots
Measurements from CSV or Excel become a data table and a scatter plot with a fitted line; slope and intercept go into the text.
Equations and calculations
Theory equations are numbered and the analysis is written out step by step, with units and significant figures in mind.
No invented data
docraft uses only the data you give it; missing details and conclusions to confirm go on the checklist.
How it works
- 1
Upload the measurements (CSV or Excel) and give the experiment, course and your details.
- 2
docraft typesets the report and lists the analysis and conclusions to confirm.
- 3
Point at a plot or table to change it, then export the PDF and hand it in.
Try saying
“Here is my pendulum data (Excel). Write it up as a lab report, plot T² against L and fit a line to find g.”
Frequently asked questions
Which data formats work?
CSV and Excel. Name the quantities and units in the header row and docraft builds the tables and plots from them.
Can I trust the fits and calculations?
They are computed from your data and listed on the checklist as well as in the text; check the key numbers before you submit.
Can it follow my school’s format?
Say which sections you need and in what order, or upload your school’s example for it to follow.
Can I use it on the free plan?
Yes. The free plan includes 300 points a month (about 18 new documents), and exported PDFs carry a watermark; paid plans have no watermark.


